Monitor View
This page covers all features of the Monitor view in eizen agentic platform. To access this view click Monitor in the navigation pane at the environment level or in an application.
Purpose
The Monitor view helps you keep an eye on activity indicators for your applications.
Elements
- Search and Filter pane
- Your Processes Activity Pane
Search and Filter Pane
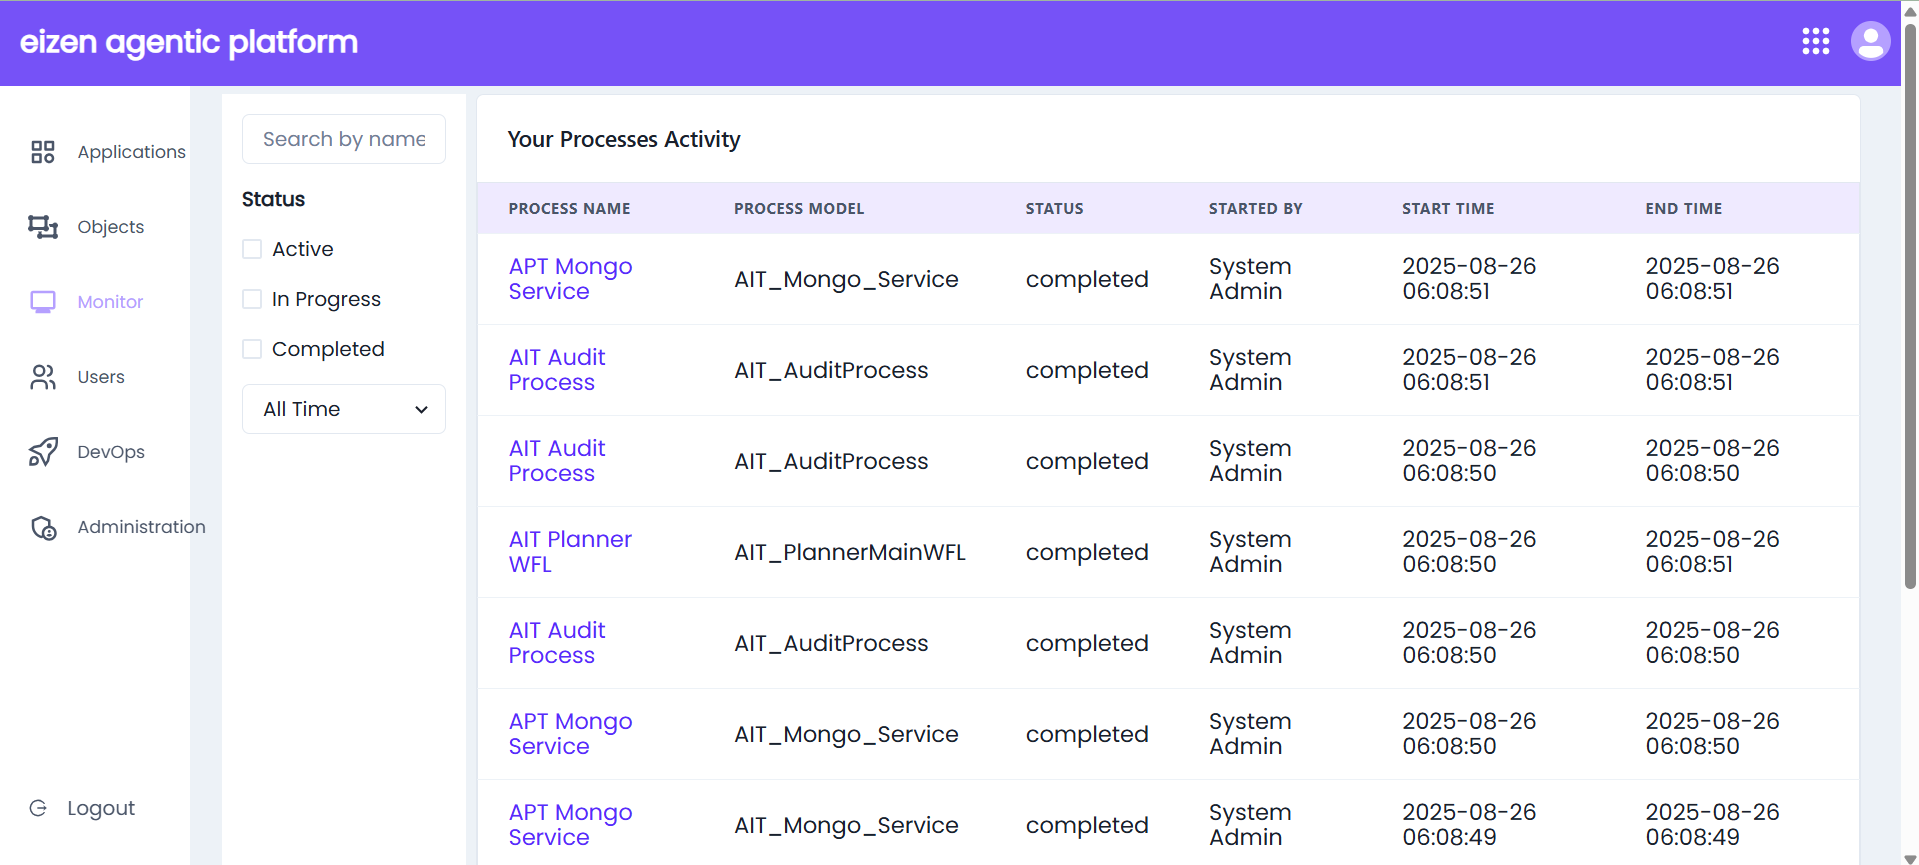
The Search and Filter Pane allows you to search or filter the processes that you want to see in the Your Processes Activity pane. It consists of the following elements to search and filter through the processes:
Search bar: Quickly locate a specific process by name or description.
Status check boxes: Filter processes by clicking on any of the following check boxes: Active, In Progress, or Completed.
Time Range Drop down: Customize results by selecting a time range: All time, Last 24 hours or Last 7 Days.
Your Processes Activity
The Your Process Activity grid displays detailed information about each process instance, including its model, current status, execution timestamps, and initiator. The other columns in the grid include the following:
| Column | Description |
|---|---|
| Process Name | Name of the process which is also a hyperlink to open Eizen-X designer. |
| Process Model | Model of the process. |
| Status | Status of the process: Active, In Progress or Completed. |
| Started by | The user who initiated the process. Typically shows System Admin for automated runs. |
| Start Time | Timestamp marking when the process started. |
| End Time | Timestamp marking when the process finished execution. For in-progress processes, this field is blank. |
| Pagination Controls | Navigate through the list of process records. Includes total pages and options to jump between them. |
| Show Rows Dropdown | Allows users to change the number of visible rows per page (e.g., 5, 10, 15). |